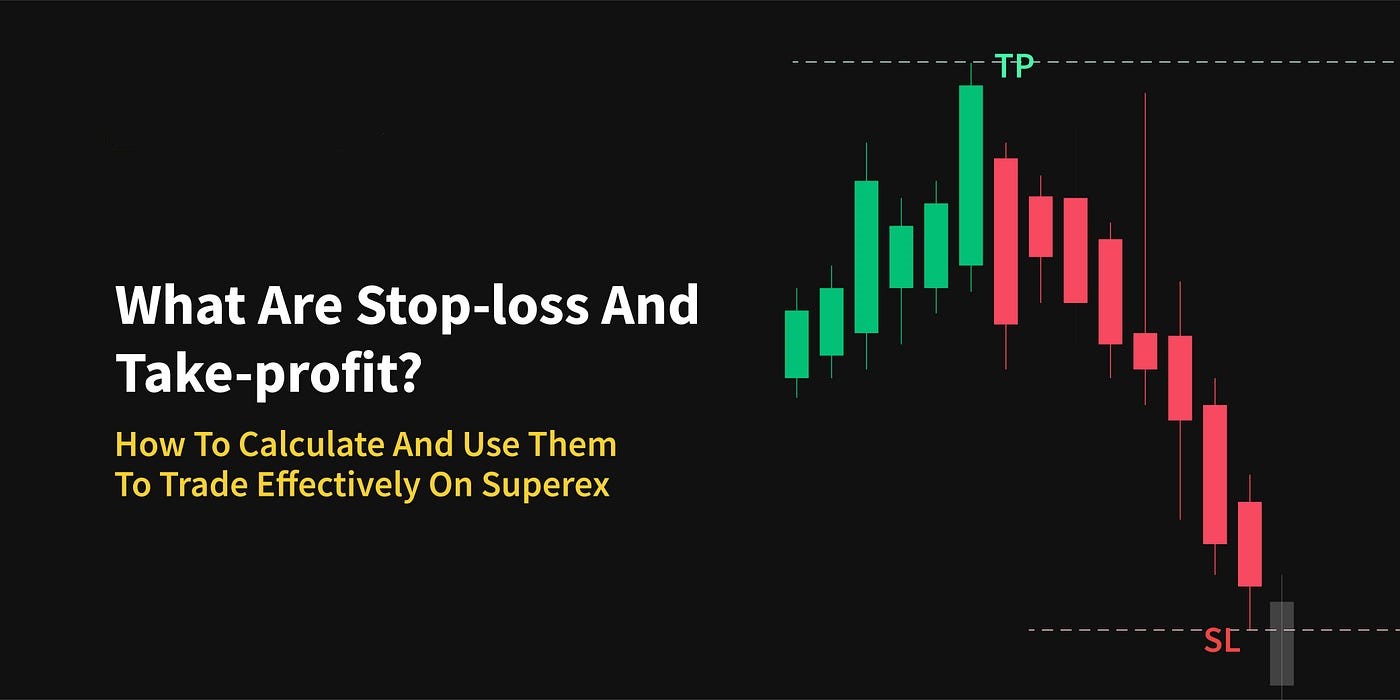
Advanced Forex Trading Strategies: The Complete Expert Guide

Advanced Forex Trading Strategies: The Complete Expert Guide
Move beyond the basics. This guide covers the institutional concepts, advanced technical frameworks, and professional risk management systems that separate consistently profitable traders from the rest of the market.
📋 Table of Contents
- How Institutions Actually Move the Market
- Smart Money Concepts (SMC) & ICT Framework
- Multi-Timeframe Confluence Trading
- Advanced Order Flow & Market Structure
- High-Probability Chart Patterns for Professionals
- Advanced Indicator Combinations That Actually Work
- Professional Risk Management & Position Sizing
- Building & Backtesting a Trading System
- Trading Psychology at the Advanced Level
- Advanced Trade Execution: Real Examples
If you already understand pips, leverage, and how to place a trade — this guide is for you. The difference between an intermediate and a professional trader is not just technical knowledge. It is a fundamentally different way of reading the market — one that understands who is moving price, why, and where the next move is likely to originate.
Professional traders do not predict the market. They read the footprints of institutional money and position themselves accordingly. This guide teaches you how to do the same.
1. How Institutions Actually Move the Market
The single most important shift in thinking for an advanced trader is understanding that retail traders do not move the forex market — institutions do. Banks, hedge funds, and central banks execute orders worth hundreds of millions of dollars. They cannot simply click "buy" like a retail trader. They need liquidity — enough opposing orders in the market to fill their massive positions without moving price against themselves.
The Liquidity Hunt
To fill large buy orders, institutions need sellers. Where are the sellers? At the stops of retail long traders — which are clustered just below obvious support levels, below previous lows, and under equal lows (EQL). This is why price so often "sweeps" a key level before reversing sharply in the opposite direction. Institutions are triggering stops to harvest the liquidity they need to enter their own positions.
Every obvious support, resistance, trendline, or "textbook" level in your chart is also obvious to every other retail trader — which means it is a cluster of stop-loss orders. Institutions know exactly where those stops are. Price moves to those stops not to break the level, but to collect the liquidity needed for the real move.
Institutional Participants & Their Role
| Participant | Role in Market | Typical Behaviour |
|---|---|---|
| Central Banks | Policy-driven currency management | Intervene at extreme levels; drive long-term macro trends via interest rate decisions |
| Commercial Banks | Currency conversion for clients + proprietary desks | Execute massive orders; create the order flow that retail traders react to |
| Hedge Funds | Speculative positioning at scale | Use macro analysis + technical timing; hold positions for days to weeks |
| Algorithmic Traders | High-frequency execution | React to news and levels in milliseconds; create spikes and false breakouts |
| Retail Traders | Minor liquidity providers | Concentrated around obvious levels; often stop-hunted before the real move |
The most common retail strategy — buying breakouts above resistance and selling breakdowns below support — positions retail traders as the liquidity that institutions need. Understanding this does not make you immune to it. But it helps you pause before chasing a breakout and ask: who is buying this? And who are they buying it from?
2. Smart Money Concepts (SMC) & ICT Framework
Smart Money Concepts — popularized by the ICT (Inner Circle Trader) methodology — provide a systematic framework for reading institutional footprints. Rather than using lagging indicators, SMC reads the raw price structure of the market to identify where institutions have been and where they are likely to act next.
Core SMC Concepts Every Expert Must Know
📌 Order Blocks (OB)
An Order Block is the last down-candle before a strong bullish move (Bullish OB) or the last up-candle before a strong bearish move (Bearish OB). These zones represent areas where institutional orders were placed. Price frequently returns to these zones to "rebalance" — offering high-probability entry points on the retest.
📌 Fair Value Gaps (FVG) / Imbalances
A Fair Value Gap forms when price moves so quickly that there is a gap between the wicks of candle 1 and candle 3 (a three-candle formation). These gaps represent price imbalances — areas where the market did not trade efficiently. Price has a strong tendency to return and fill these gaps before continuing the original trend.
📌 Break of Structure (BOS) vs. Change of Character (ChoCH)
A Break of Structure (BOS) is a continuation signal — price breaks the previous high or low in the direction of the current trend. A Change of Character (ChoCH) signals a potential trend reversal — price breaks the most recent swing point against the current trend. Distinguishing between the two is essential for not misreading continuations as reversals.
📌 Inducement (IDM)
Inducement is a deliberate liquidity sweep before the real institutional move. It is a lower-timeframe swing point that forms to pull retail traders into the wrong direction before price sharply reverses. Identifying inducement prevents you from entering prematurely on a false setup.
The classic SMC trade setup: (1) Identify the higher-timeframe bias (bullish or bearish). (2) Wait for a liquidity sweep / inducement on the lower timeframe. (3) Confirm a Change of Character in the opposite direction. (4) Enter on the return to the nearest Order Block or Fair Value Gap. (5) Set stop beyond the sweep low/high with a 2:1 or 3:1 R:R target.
3. Multi-Timeframe Confluence Trading
Amateur traders pick one timeframe and trade it in isolation. Professional traders use a top-down analysis approach — reading the market from the highest timeframe down to the entry timeframe. Confluence between multiple timeframes is one of the most powerful filters for high-probability setups.
The Three-Timeframe Framework
Higher Timeframe (HTF) — Bias Formation
Use the Weekly and Daily chart to determine the macro trend. Identify key swing highs and lows, major supply and demand zones, and whether price is in a premium or discount area of a larger range. This timeframe gives you your directional bias — the only direction you should be looking to trade on lower timeframes.
Intermediate Timeframe (ITF) — Setup Formation
Use the 4-Hour and 1-Hour chart to identify the setup. Here you look for market structure shifts aligned with the HTF bias, order blocks to target as entry zones, and liquidity pools that price is likely to sweep before reversing. The ITF is where you find the trade.
Lower Timeframe (LTF) — Entry Precision
Use the 15-Minute and 5-Minute chart to time your entry with precision. Wait for a Change of Character (ChoCH) or a specific candle pattern within the Order Block identified on the ITF. This allows you to dramatically reduce your stop-loss size while maintaining the same profit target — improving your risk-to-reward ratio.
Never enter a trade on the lower timeframe that goes against the higher-timeframe bias. If the Daily chart is bearish, you should only be looking for short entries on the 1-Hour — no matter how bullish the 15-minute looks. The higher timeframe always wins.
Session Bias — The Time Element
Smart money does not operate randomly. The major trading sessions create predictable structural patterns that expert traders exploit. The Asian session (Tokyo) typically builds liquidity through consolidation. The London Open is where the majority of significant moves begin — often sweeping the Asian session highs or lows first. The New York session confirms the London move or creates a reversal.
| Session | Time (GMT) | Typical Behaviour | Best Strategy |
|---|---|---|---|
| Asian (Tokyo) | Midnight – 9 AM | Consolidation, range building, liquidity pool formation | Identify the range; anticipate the break direction |
| London Open | 7 AM – 12 PM | High volatility; sweeps Asian highs/lows; establishes the day's trend | Fade the London sweep; enter after ChoCH |
| New York Open | 12 PM – 5 PM | Confirms or reverses London; major news releases; highest volume | Trade continuation or look for NY reversal at key HTF levels |
| London Close | 4 PM – 5 PM | Often sees a reversal or pullback as London positions are closed | Use with caution; fade moves into close near strong levels |
4. Advanced Order Flow & Market Structure
Market structure is the foundation of all technical analysis. At the expert level, structure is read not just as higher highs and lower lows, but as a dynamic, living narrative of who is in control of price and where that control is likely to shift.
Premium vs. Discount Pricing
Every range has a 50% equilibrium point. Price above the 50% is considered premium — institutions sell in premium zones. Price below 50% is discount — institutions buy in discount zones. As a professional trader, you should only look to buy in discount and only look to sell in premium. This single filter eliminates a significant portion of low-probability setups.
The 0.5 (50%) Fibonacci level defines equilibrium. The 0.618–0.705 zone is the "optimal trade entry" (OTE) — the sweet spot where institutional buying/selling is most concentrated. Drawing Fibonacci from the last significant swing low to swing high (or vice versa) and waiting for price to retrace into the OTE zone is one of the highest-probability entry methods available.
Liquidity Concepts at the Expert Level
- Buy-side Liquidity (BSL): Resting above swing highs, equal highs (EQH), trendline highs. These are buy-stop orders from shorts. Institutions sweep BSL to fill large sell orders.
- Sell-side Liquidity (SSL): Resting below swing lows, equal lows (EQL), trendline lows. These are sell-stop orders from longs. Institutions sweep SSL to fill large buy orders.
- Void/Propulsion Blocks: Areas of rapid price displacement with minimal wicks — indicate aggressive institutional participation and typically act as strong support/resistance on retests.
- Mitigation Blocks: After an order block has been used and the trade is in profit, the mitigation block is the next level where the position is reduced — offering a secondary entry opportunity for traders who missed the initial OB entry.
5. High-Probability Chart Patterns for Professionals
Not all chart patterns are equal. At the professional level, patterns are only traded when they form at key structural levels with multi-timeframe confluence. A head-and-shoulders forming in the middle of a range is noise. The same pattern forming at a Daily supply zone after a BSL sweep is a high-probability setup.
Spring & Upthrust (Wyckoff)
A Spring is a false breakdown below support followed by a sharp reversal — accumulation in disguise. An Upthrust is a false breakout above resistance followed by a reversal — distribution. Both are institutional stop-hunts before the real move.
Breaker Blocks
A Breaker is a failed Order Block — an OB that was violated, signalling a structural shift. After the violation, the broken OB flips polarity and becomes a strong reversal zone. Breakers are among the most reliable re-entry points after a trend continuation.
Wyckoff Accumulation Schematic
The full Wyckoff schematic — PS, SC, AR, ST, Spring, SOS — describes how institutions accumulate a position over time. Recognising a Wyckoff accumulation structure on the Daily chart while price is in a discount zone is a high-conviction long setup.
FVG + OB Confluence Zone
When a Fair Value Gap and an Order Block overlap on the same timeframe, the confluence zone is among the highest-probability entry areas on any chart. Institutional volume concentrates here. Entries within this zone with a tight stop offer exceptional R:R.
Power of 3 (PO3) — AMD
ICT's Accumulation-Manipulation-Distribution model. Markets accumulate during the Asian session, manipulate in one direction at London Open (sweeping the Asian range), then distribute in the true direction for the New York session. Knowing which phase you are in dramatically improves entry timing.
FOMC / NFP Reaction Fade
Major news events create violent, engineered moves that often reverse. The initial spike on an NFP or FOMC release sweeps liquidity. Professional traders wait for the spike, identify the swept level, and fade the move back once a ChoCH forms on the 1-minute or 5-minute chart.
6. Advanced Indicator Combinations That Actually Work
Most experienced traders eventually move toward price action over indicators. But certain indicator combinations — when used as confirmation tools, not as primary signals — provide genuine value at the expert level.
| Indicator | Advanced Application | Best Timeframe |
|---|---|---|
| RSI (Relative Strength Index) | Divergence between price action and RSI at key structural levels — a far stronger signal than standard overbought/oversold readings | 4H, Daily |
| MACD | Histogram reduction + zero-line retest as momentum confirmation before re-entry; not for primary signals | 1H, 4H |
| Volume Profile (VPVR) | Identifying the Point of Control (POC) and Low Volume Nodes (LVN) — price moves quickly through LVNs and stalls at High Volume Nodes (HVN) | Daily, 4H |
| ATR (Average True Range) | Dynamic stop-loss sizing (1.5–2× ATR); avoiding entries when ATR is near period extremes | All timeframes |
| VWAP (Volume Weighted Average Price) | Institutional benchmark — price above VWAP is bullish; below is bearish. VWAP re-tests are high-quality entry points intraday | 15M, 1H (intraday) |
| EMA 200 / EMA 50 Cross | Not for entries — purely for directional bias confirmation on the higher timeframe. Never counter-trade the EMAs on the Daily. | Daily, Weekly |
The biggest trap for intermediate traders is adding more indicators to solve a fundamental analysis problem. If your win rate is low, the issue is almost never the indicator — it is your understanding of market structure. Clean charts with raw price action outperform indicator-heavy setups for experienced traders in study after study. Use indicators to confirm, never to decide.
7. Professional Risk Management & Position Sizing
The difference between a profitable system and a profitable career is risk management. Many traders have a system with a positive expectancy that they destroy through inconsistent position sizing, revenge trading, and ignoring their rules after losing streaks.
Kelly Criterion — Advanced Position Sizing
The Kelly Criterion is a mathematical formula used by professional fund managers to calculate the optimal fraction of capital to risk per trade based on your historical win rate and average R:R:
📐 Kelly Criterion Formula
Where: W = Win Rate, R = Average Win ÷ Average Loss
Drawdown Management Rules
- Maximum Daily Drawdown: Set a daily loss limit (e.g., 3% of account). If hit, stop trading for the day entirely — no exceptions. Consecutive losses are frequently the result of emotional decision-making, not bad setups.
- Maximum Weekly Drawdown: Set a weekly limit (e.g., 6%). If reached mid-week, reduce position sizes to 50% for the remainder of the week to protect the monthly performance.
- Account Recovery Rules: If your account drops below a key threshold (e.g., 20% drawdown), cut position size by 50% and do not return to normal sizing until the account recovers to within 10% of the previous high.
- Correlation Risk: Never hold two positions that are positively correlated simultaneously at full size (e.g., EUR/USD long and GBP/USD long) — you are effectively doubling your risk on a single macro move.
Institutional traders at major banks risk a maximum of 0.5–1% of their allocated capital per trade. Retail traders often risk 5–10%. The professionals who survive decades in the market are not the best analysts — they are the most disciplined risk managers. Survive long enough and skill compounds.
8. Building & Backtesting a Trading System
A trading system is not a collection of ideas — it is a complete, rules-based framework with defined entry conditions, exit conditions, position sizing rules, and filters. Professional traders treat their system like a business plan: it must be testable, measurable, and improvable.
The Five Components of a Complete Trading System
Market & Instrument Filter
Which pairs do you trade? Which sessions? Under what volatility conditions? Narrow your focus to 2–3 pairs at most. Specialists outperform generalists in forex. Know your pairs' correlations, typical daily ranges, and macro sensitivities cold.
Setup Criteria (Rules-Based Entry)
Define the exact conditions that must be met before you consider entering a trade. "The HTF must show a bullish bias via structure, price must be in a discount zone, and a 1H FVG + OB confluence must exist" is a setup. "Price looks good" is not. If you cannot write it in a checklist, it is not a system.
Entry Trigger (Precise Execution)
The setup tells you where to look. The trigger tells you exactly when to pull the trigger. Common expert triggers: a bullish engulfing candle closing within a defined OB on the 5M chart; a confirmed ChoCH on the 15M inside a 1H OB; a volume spike reversal candle at a FVG zone.
Stop Loss & Take Profit Rules
Stop placement must be logical, not arbitrary. Stops go beyond the structural invalidation point — above the swept high for shorts, below the swept low for longs. Target placement uses the next significant liquidity pool, opposing Order Block, or a fixed R:R ratio. Never move your stop loss further away after entry.
Trade Management & Scaling Rules
Define when and how you move to break-even (e.g., when price hits 1R in profit). Define if and how you scale out (e.g., 50% at 1.5R, remainder at 3R). Define when you take partials vs. hold for the full target. Consistency in management is as important as consistency in entry.
Backtesting Standards for Professionals
- Minimum 200 trade sample size before drawing any conclusions about a system's viability
- Test across multiple market conditions: trending, ranging, and high-volatility news periods
- Record every trade: date, pair, setup type, entry/exit price, R:R, outcome, and a screenshot
- Calculate: Win Rate, Average R:R, Profit Factor (gross profit ÷ gross loss — should be above 1.5), Maximum Consecutive Losses, Maximum Drawdown
- Forward test on demo for a minimum of 3 months before committing live capital to a new system
9. Trading Psychology at the Advanced Level
At the beginner level, psychology is about controlling fear. At the expert level, it is about something far more subtle: protecting your process from your own intelligence. Advanced traders are often their own worst enemy — they see patterns that are not there, rationalise rule breaks with sophisticated arguments, and confuse analytical skill with trading skill.
Advanced Psychological Pitfalls
- Hindsight Bias Contamination: Reviewing trades and always being able to "see what you should have done" creates false confidence in your analytical ability. The question is never what you can see after the fact — it is what your rules said at the moment of decision.
- Overfit Thinking: Building a system around the last 10 trades you lost is curve-fitting. Markets change. Your system must work statistically, not perfectly on every recent loss.
- Confidence Creep: After a winning streak, traders unconsciously increase position size, reduce stop distances, and take lower-quality setups. Track your stats rigorously — the data will reveal this long before the drawdown does.
- Analysis Paralysis: The expert paradox — knowing too much can produce decision paralysis. Simplify your execution framework deliberately. More information does not always produce better decisions.
True trading mastery is the ability to execute your system mechanically, without emotional interference, trade after trade — regardless of the last outcome. You cannot know in advance which individual trade will win. You can only ensure that over the next 100 trades, your edge expresses itself statistically. This requires surrendering the need for any single trade to be a winner.
10. Advanced Trade Execution: Real Examples
Example 1 — ICT Smart Money Setup on EUR/USD
📊 EUR/USD — London Open SMC Short Setup
Example 2 — Multi-Timeframe Confluence Long on GBP/USD
📊 GBP/USD — Weekly Demand + 4H OTE Long Setup
A system with a 50% win rate and a consistent 2:1 R:R, traded with 1% risk per trade over 100 trades, produces a net gain of approximately 50R — or 50% on a well-sized account. That is not exciting on any individual trade. Over a year of disciplined execution, it is transformative. The compounding of edge over time is the real profit driver — not finding the perfect setup.
Final Thoughts: Expertise Is a System, Not a Secret
The traders who operate at a professional level are not in possession of secret knowledge unavailable to everyone else. What separates them is the rigorous application of a defined framework, executed consistently, over a long enough time horizon. They have done the backtesting. They know their numbers. They follow their rules — especially when emotions push them to do otherwise.
The concepts in this guide — Smart Money Concepts, multi-timeframe confluence, professional risk systems — are only as valuable as the discipline with which you apply them. Build your system. Test it relentlessly. Journal every trade. Improve iteratively. There are no shortcuts to expertise, but with the right structure, the path is clear.
Ready to Trade at the Next Level?
Access professional-grade analysis, daily trade setups, and our advanced strategy library on OneTradingPro.
Explore the Trading Education Hub →❓ Frequently Asked Questions — Advanced Forex Trading