Day Trading Strategies: The Complete Expert Guide (2026)

Day Trading Strategies: The Complete Expert Guide (2026)
Learn the exact strategies professional day traders use to extract consistent profits from intraday markets — from scalping and momentum trading to breakout setups and disciplined risk management.
📋 Table of Contents
- What is Day Trading? A Professional Definition
- The Most Profitable Day Trading Strategies
- Scalping Strategy — The Speed Game
- Momentum Trading Strategy
- Breakout Trading Strategy
- Reversal & Mean Reversion Trading
- News-Based Day Trading
- Technical Indicators for Day Traders
- Risk Management — The Real Edge
- Building Your Day Trading Routine
- Real Trade Examples with Entry & Exit
Day trading is one of the most misunderstood activities in financial markets. Popular culture paints it as either a path to instant wealth or a guaranteed way to lose money. The truth, as always, lies in the details — specifically in strategy, discipline, and an uncompromising approach to risk.
This guide does not promise shortcuts. Instead, it gives you the complete framework used by professional intraday traders: the strategies, the setups, the indicators, and — most critically — the risk management principles that determine whether any strategy survives contact with real markets.
1. What is Day Trading? A Professional Definition
Day trading means opening and closing all positions within the same trading day — no overnight exposure. Every trade begins and ends within market hours, eliminating gap risk from news that breaks after the close.
Unlike swing trading (days to weeks) or investing (months to years), day trading demands rapid decision-making, strict intraday risk controls, and a deep understanding of how price behaves on short timeframes — from 1-minute charts all the way to the 1-hour.
Who Actually Makes Money Day Trading?
Studies consistently show that the majority of retail day traders lose money over time. But this statistic obscures an important truth: the traders who lose are almost always those without a defined strategy, without risk management, and without sufficient statistical testing of their approach. Professional day traders — those who treat it as a business — operate very differently.
The Professional Difference
A professional day trader does not try to win every trade. They aim for a positive expectancy over many trades: a win rate and average R:R combination that produces net profit after all costs. A 45% win rate with a 2.5:1 R:R is far more valuable than a 70% win rate with a 0.8:1 R:R.
| Trading Style | Timeframe | Trades Per Day | Typical R:R | Key Skill |
|---|---|---|---|---|
| Scalping | 1M – 5M chart | 10–50+ | 1:1 – 1.5:1 | Execution speed, discipline |
| Momentum Day Trading | 5M – 15M chart | 2–8 | 2:1 – 4:1 | Reading order flow |
| Breakout Trading | 15M – 1H chart | 1–4 | 2:1 – 5:1 | Level identification |
| Reversal Trading | 5M – 30M chart | 1–5 | 2:1 – 4:1 | Market structure reading |
| News Trading | 1M – 5M chart | 1–3 | 2:1 – 6:1 | News interpretation + speed |
2. The Most Profitable Day Trading Strategies
There is no universally "best" day trading strategy. The best strategy for any individual trader is the one they can execute consistently, without emotional interference, with a tested positive expectancy. That said, the following strategies have the most robust track records across different market conditions.
⚡ Scalping
Dozens of small trades per session, targeting 5–15 pip moves. Requires tight spreads, fast execution, and extreme discipline. Best on EUR/USD and major pairs.
🚀 Momentum Trading
Riding strong directional moves that form at session opens or after news events. Fewer trades, higher R:R, requires patience and trend identification skill.
📊 Breakout Trading
Entering when price breaks significant levels — daily highs/lows, consolidation ranges, or key S/R. Requires patience to wait and discipline to avoid false breaks.
🔄 Reversal Trading
Fading overextended moves at key structural levels. Higher skill requirement but excellent R:R when timed correctly. Best combined with SMC concepts.
📰 News Trading
Trading the reaction to economic releases (NFP, CPI, FOMC). Very high volatility, high risk — but predictable liquidity patterns for experienced traders.
📉 Mean Reversion
Trading price back toward its average after an extreme deviation. Works well in ranging markets. Uses Bollinger Bands, VWAP, and statistical price levels.
3. Scalping Strategy — The Speed Game
Scalping is the art of making many small profits that accumulate into meaningful daily gains. A scalper targets moves of 5–20 pips, entering and exiting within minutes — sometimes seconds. The model works on volume and consistency, not on big individual wins.
What Makes a Good Scalping Setup
📌 The 1-Minute Bid-Ask Scalp
Watch the 1M chart during London or NY Open. Price often makes a sharp move in one direction, consolidates briefly, then makes a second leg. Enter the pullback into the consolidation with a 5-pip stop and a 7–10 pip target. Volume and spread must be tight for this to work.
📌 EMA Ribbon Scalp
Use a 5-EMA and 13-EMA on the 1M or 5M chart. When both EMAs align in one direction and price pulls back to touch the 5-EMA, enter in the direction of the ribbon. Stop below the most recent swing low. Target the next obvious resistance level or 1.5× your stop distance.
Scalping Reality Check
Scalping is the most demanding strategy mentally and technically. Transaction costs (spread + commission) eat heavily into small profits. A 1-pip spread on a 7-pip target means you are giving away 14% of your profit before the trade even closes. Only scalp with ECN brokers offering raw spreads below 0.5 pips on majors.
| Scalping Parameter | Recommended Setting | Reason |
|---|---|---|
| Timeframe | 1M or 5M chart | Enough candle data to read structure |
| Session | London Open (7–10 AM GMT) | Highest volume + tight spreads |
| Pairs | EUR/USD, GBP/USD, USD/JPY | Tightest spreads, most liquidity |
| Target | 7–15 pips | Achievable without holding too long |
| Stop Loss | 5–8 pips | Structural invalidation points |
| Max Trades/Session | 10–15 | Prevents overtrading and fatigue |
4. Momentum Trading Strategy
Momentum traders ride the energy of strong directional moves. When price breaks out of a range with volume, or when a major session opens with clear directional intent, momentum traders identify the move early, enter on the first pullback, and ride the trend until momentum exhausts.
Identifying True Momentum vs. Noise
Not every strong candle is momentum. True momentum has specific characteristics that separate it from random volatility spikes:
- Volume confirmation: A momentum move should be accompanied by significantly above-average volume. Price moving without volume is usually a false breakout or stop hunt.
- Clean impulsive structure: Momentum candles are large, have small wicks, and appear in succession. Multiple consecutive bullish candles with minimal retracement signal genuine buying pressure.
- Session context: Momentum at the London Open or NY Open is more reliable than mid-session moves. Institutional participation is highest at these times.
- Break of prior structure: True momentum typically breaks a meaningful prior high or low — it is not just a move within a range.
The Momentum Entry Framework
Identify the Momentum Candle
Watch for a large, clean candle (body = 70%+ of total candle range) on the 5M or 15M chart that breaks a meaningful prior level. This is the "impulse" — the signal that institutional money is moving.
Wait for the First Pullback
After the impulse candle, price almost always retraces 30–50% before continuing. This is your entry zone. Do NOT chase the impulse candle — wait for the market to come to you. Patience here is everything.
Enter on Confirmation
Enter when the pullback stalls and shows a reversal signal — a small engulfing candle, a pin bar, or a close back above/below a key EMA. Your stop goes below the pullback low (for longs) with a minimum 2:1 R:R target.
Manage the Trade
Move stop to break-even when trade reaches 1R profit. Take 50% off at 2R, let the rest run toward the next structural target. Never hold a momentum trade through a major opposing news event.
5. Breakout Trading Strategy
Breakout trading is one of the most intuitive strategies — price consolidates, builds energy, and then breaks with force. The key skill is distinguishing genuine breakouts from false breakouts (also called fakeouts), which are engineered by institutions to trap retail traders before reversing.
Types of Breakouts Worth Trading
📌 Opening Range Breakout (ORB)
The first 15–30 minutes of a major session (London or NY) forms a range. When price breaks above or below that range with a strong close, enter in the breakout direction. The ORB is one of the most statistically reliable day trading setups available.
📌 Previous Day High/Low Breakout
Yesterday's high and low are major reference points for institutional order flow. A clean break above the previous day's high — especially on the NY open — with volume often produces 40–80 pip intraday moves on major pairs.
📌 Consolidation Range Breakout
When price compresses into a tight range (inside bars, triangles, rectangles) for 4+ candles on the 15M chart, it is coiling energy. The resulting breakout is often sharp and sustained. Enter the break of the range high/low with a stop inside the range.
Avoiding False Breakouts
The most common breakout mistake is entering on the first candle that breaks the level. Instead, wait for a candle to close beyond the level — not just wick through it. Even better, wait for a retest of the broken level as new support/resistance before entering. This dramatically reduces false breakout entries.
6. Reversal & Mean Reversion Trading
Reversal trading is counter-trend — you are betting that an overextended move will snap back. It carries higher risk than trend-following strategies but offers exceptional R:R when executed at the right locations. The key is only trading reversals at high-confluence structural levels, never in the middle of a range.
Where Reversals Are Worth Trading
- Daily/Weekly Supply & Demand Zones: When price reaches a higher-timeframe zone after a long impulsive move, the probability of at least a short-term reversal is high. The move to the zone is the setup; the reversal signal on the lower timeframe is the trigger.
- VWAP Extremes: Price trading 2–3 standard deviations from VWAP intraday is statistically overextended. Mean reversion back toward VWAP is one of the most reliable intraday reversal setups, particularly on forex and indices.
- Previous Day High/Low + Liquidity Sweep: When price sweeps through a key level (triggering stops) and immediately reverses — a classic liquidity hunt — this is a high-probability reversal. The sweep + close back below/above the level is the signal.
Reversal Trap
Never trade reversals against a strong intraday trend on a lower timeframe level. You need higher-timeframe confluence — a Daily or 4H level — to justify a reversal entry. Counter-trend trades on lower timeframes alone have poor expectancy.
7. News-Based Day Trading
Economic news releases create the highest-volatility moments in the forex market. Events like Non-Farm Payrolls (NFP), CPI inflation data, and FOMC rate decisions can move major pairs 50–200 pips within minutes. For professional traders, this volatility is opportunity — but only with the right framework.
The Two Approaches to News Trading
📌 Approach 1 — Trade the Reaction Fade
The initial spike on major news events frequently reverses. Institutions use the news to trigger retail stops and fill their own positions. After the initial spike, wait 30–60 seconds for the market to show a clear rejection of the move (pin bar, engulfing candle), then fade the spike back toward the pre-news level. Stop above the spike high, target the pre-news range.
📌 Approach 2 — Trade the Second Move
After the initial chaotic reaction settles (2–5 minutes post-release), the "real" market move begins. This is driven by the actual fundamental implication of the data — not just the initial stop hunt. Enter in the direction of the second move after a 5M candle confirms direction. This approach is lower risk than fading the initial spike.
| News Event | Time (GMT) | Impact | Best Approach |
|---|---|---|---|
| Non-Farm Payrolls (NFP) | 1st Fri, 12:30 PM | Extreme | Fade initial spike or trade second move |
| FOMC Rate Decision | Monthly, 7 PM | Extreme | Wait for press conference — trade trend |
| CPI Inflation | Monthly, 12:30 PM | High | Trade second move 5–10 min after release |
| GDP Data | Quarterly | Medium-High | Trade in direction of surprise vs forecast |
| Retail Sales | Monthly | Medium | Second move approach after initial candle closes |
8. Technical Indicators for Day Traders
Day traders should use minimal, high-quality indicators rather than cluttered charts. Each indicator should serve a specific purpose: trend direction, momentum confirmation, or entry timing. More indicators create conflicting signals and decision paralysis.
| Indicator | Purpose | Best Setting | How to Use |
|---|---|---|---|
| VWAP | Intraday bias + mean reversion | Default (daily reset) | Above VWAP = bullish bias; retest = entry signal |
| EMA 9 / EMA 21 | Short-term trend direction | 9 & 21 periods | Price above both = long bias; cross = momentum signal |
| EMA 200 | Major trend filter | 200 period | Only trade longs above 200 EMA; only shorts below |
| RSI | Momentum & divergence | 14 period, 5M chart | Divergence at key levels — not standard OB/OS signals |
| ATR | Volatility & stop sizing | 14 period | Stop = 1–1.5× ATR; avoid entries when ATR is extremely low |
| Bollinger Bands | Volatility & mean reversion | 20 period, 2 SD | Price at outer band + reversal candle = mean reversion entry |
| Volume | Confirmation | Raw volume bars | Above-average volume confirms breakouts; low volume = trap |
Recommended Day Trading Chart Setup
Most professional day traders use: VWAP + EMA 9/21 + Volume. That is it. Everything else is noise. Add the EMA 200 on a higher timeframe chart for bias, and you have a complete, clean decision-making framework. Fewer decisions = better execution.
9. Risk Management — The Real Edge
Every professional day trader will tell you the same thing: strategy gets you in the door, but risk management keeps you in the game. The majority of traders who fail do so not because of bad strategies but because of poor risk controls — overleveraging, revenge trading, and ignoring stop losses.
The Non-Negotiable Risk Rules
- 1–2% max risk per trade: Never risk more than 2% of your account on a single trade. At this level, you can survive 20 consecutive losing trades and still be in the game. Most professionals risk 0.5–1%.
- Daily loss limit: Set a hard daily loss cap at 3–5% of account. If you hit it, stop trading immediately — no exceptions. Losing days become catastrophic only when you keep trading after the limit is hit.
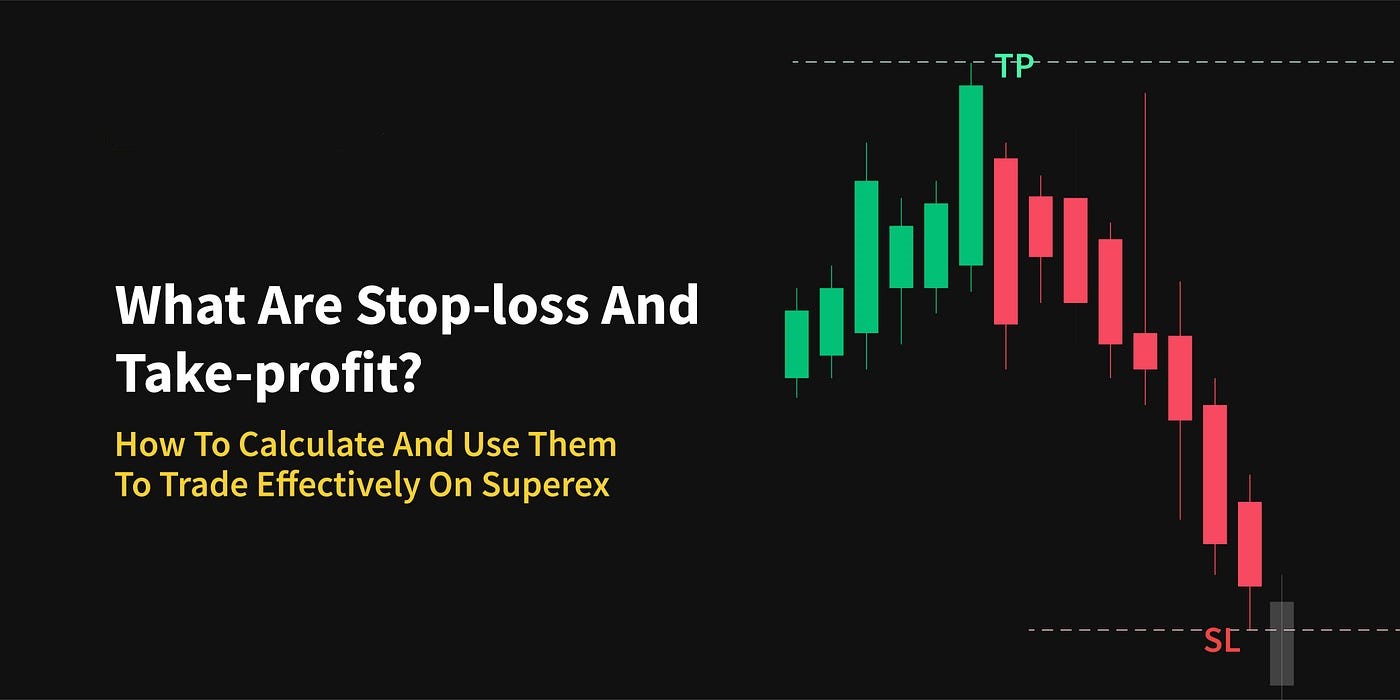
- Stop losses are mandatory: No trade without a stop loss. Ever. A market can move 100 pips in seconds on a news event. Unprotected positions have destroyed accounts that took years to build.
- Risk-to-reward minimum: Never take a trade with less than 2:1 R:R. If your stop must be 20 pips to be logical, your target must be at least 40 pips. Trades with poor R:R are simply not worth taking regardless of how confident you feel.
- Position sizing is calculated, not guessed: Use the formula: Position Size = (Account × Risk%) ÷ (Stop Loss in pips × Pip Value). Every. Single. Trade.
📐 Position Sizing Example
The Compound Effect
A $10,000 account, risking 1% per trade, with a 50% win rate and 2:1 R:R, produces approximately +50R over 100 trades — that is $5,000 net gain before compounding. The math is simple; the execution is everything.
10. Building Your Day Trading Routine
Professional day traders do not sit at their screens all day waiting for opportunities. They follow a structured daily routine that prepares them for the market, limits their active trading window, and includes a disciplined post-session review.
Pre-Market Preparation (30–45 min before open)
Check the economic calendar for high-impact news. Review the previous day's high, low, and close on your target pairs. Mark key levels on your charts: Daily S/R, weekly pivots, previous day range. Determine your bias for the session — bullish, bearish, or neutral.
Active Trading Window (2–4 hours maximum)
Focus on the highest-probability window: London Open (7–10 AM GMT) or NY Open (12–3 PM GMT). Do not trade the dead zone between sessions (10 AM – 12 PM GMT) — spreads widen and moves are unreliable. Stick to your pre-planned setups only.
Hard Stop Rules
If you hit your daily loss limit — stop. If you have made 3× your daily target — stop. If you feel frustrated, angry, or overly excited — stop. The market will be there tomorrow. Protecting your capital and your mental state is more important than any single session.
Post-Session Review (15–20 min after close)
Review every trade: screenshot, entry reason, exit reason, outcome, and — critically — whether you followed your rules. Over time, your journal is your most valuable trading tool. Patterns in mistakes appear only when you track them consistently.
11. Real Trade Examples with Entry & Exit
Example 1 — Momentum Trade on EUR/USD
📊 EUR/USD — London Open Momentum Long
Example 2 — Opening Range Breakout on GBP/USD
📊 GBP/USD — NY Open ORB Short Setup
The Common Thread
Notice what both examples share: higher-timeframe bias confirmed first, a specific structural setup identified, a precise trigger used, and stop placed at a logical invalidation point. This is the template for every professional day trade — not gut feel, not random entries, but a structured, repeatable process.
Final Thoughts: Day Trading is a Skill, Not a Gamble
Day trading done correctly is not gambling. It is a skill-based activity with a definable edge that compounds over time through consistent, disciplined execution. The traders who fail treat it like gambling — random entries, no risk rules, chasing losses. The traders who succeed treat it like a business — structured processes, defined rules, and an obsessive focus on protecting capital.
Master one strategy completely before adding another. Journal every trade. Test everything before risking real money. And above all — respect your risk rules even when every instinct tells you to ignore them. That discipline, more than any individual strategy, is what separates professionals from the rest.