Price Action Trading Guide: Read the Market Without Indicators
Price Action: How to Read the Market Without Drowning in Indicators
Open ten different trading charts and you'll often see the same thing: a screen so cluttered with indicators that the actual candles are barely visible underneath. Somewhere along the way, a lot of traders forget that every single indicator is just derived from one thing — price itself. So why not just read that directly?
That's the entire idea behind price action trading. Instead of layering on oscillators and moving averages, you study the raw movement of price — the candles, the highs and lows, the patterns that repeat again and again — and make decisions based on what the market is actually doing right now, not what a lagging formula says it did a few periods ago.
What Is Price Action Trading?
Price action trading is the practice of analyzing raw price movement — candlestick shapes, swing highs and lows, chart patterns, and support and resistance zones — to make trading decisions, with little or no reliance on lagging indicators.
Think of it like the difference between reading a weather report and actually stepping outside to feel the wind and look at the sky. Indicators are the weather report — useful, but always a step removed from reality and slightly delayed. Price action is walking outside and reading the conditions directly as they unfold.
The core belief here is that price already reflects everything the market knows — every buyer's confidence, every seller's fear, every bit of news already priced in. So rather than filtering that information through multiple calculated layers, price action traders go straight to the source: the candles themselves.
Price Action vs Day Trading vs Long-Term Investing
It's worth clarifying that price action isn't really a competing timeframe like day trading or investing — it's a method that can be applied across any of them. But it's useful to see how it fits alongside the more familiar styles.
- Day trading: Focused on intraday moves, often closing all positions before the session ends. Price action here means reading candle patterns on short timeframes for quick, same-day decisions.
- Price action trading: Can be applied on any timeframe — from 5-minute charts to weekly charts — using candlestick behavior and structure rather than fixed indicators to time entries and exits.
- Long-term investing: Driven mainly by fundamentals and broad economic trends, with far less emphasis on individual candle patterns and much more on company or macroeconomic health.
If indicators are like following a recipe step by step, price action strategy is more like a chef who's cooked the same dish a thousand times — they can taste, smell, and see when something's off without needing to measure every single ingredient again.
Best Patterns and Indicators for Price Action Trading
Price action doesn't mean throwing away every tool — it means anchoring decisions in raw price behavior first, and using a few supporting tools second. Here's what shows up repeatedly in solid technical analysis for price action trading.
Candlestick Patterns
Patterns like the pin bar, engulfing candle, and doji are the alphabet of price action. A pin bar with a long wick rejecting a key level often signals a sharp reversal in sentiment; an engulfing candle that fully swallows the previous one can show a decisive shift in control between buyers and sellers.
Support and Resistance Zones
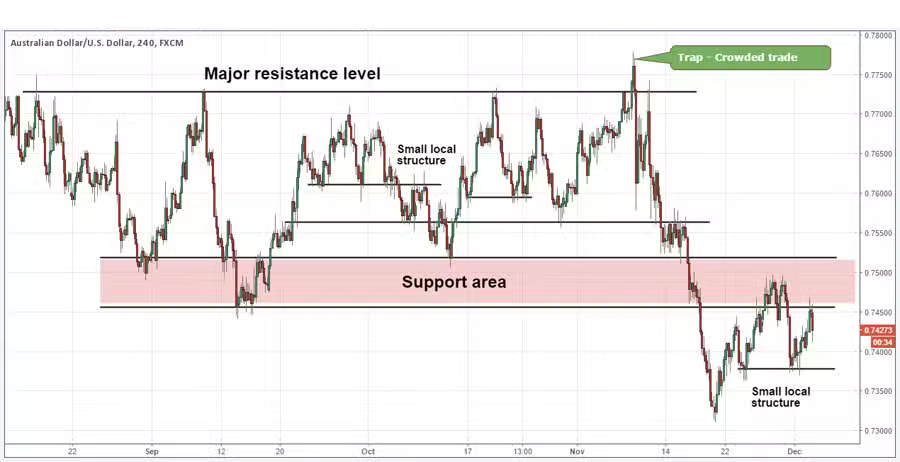
These are the price levels where the market has repeatedly reversed or paused in the past. A candlestick pattern forming right at a well-tested support or resistance zone carries far more weight than the same pattern appearing in the middle of nowhere on the chart.
Trendlines and Market Structure
Drawing simple trendlines across swing highs and lows helps map out the broader structure — higher highs and higher lows in an uptrend, or lower highs and lower lows in a downtrend. A break of this structure is often one of the earliest, most reliable signs that a trend is losing steam.
Chart Patterns
Formations like head and shoulders, double tops and bottoms, and flags are classic price action tools among the best indicators for price action trading. These patterns represent visible battles between buyers and sellers playing out directly on the chart, often preceding meaningful moves once they complete.
Volume as Confirmation
While price action leans on candles first, volume still plays a supporting role. A breakout candle on strong volume carries more conviction than the same shape appearing on a quiet, low-volume session — it's the difference between a crowd cheering and a lone voice in an empty room.
The strength of price action comes from combining these layers — a candlestick signal, at a meaningful level, within the context of overall market structure — rather than relying on any single pattern in isolation.
Risk Management Tips for Price Action Trading
Reading candles well doesn't remove the need for discipline — if anything, it makes good risk management even more essential, since price action signals can still fail.
- Place stops beyond the pattern's structure. A stop-loss just past the wick of a pin bar or the edge of a chart pattern respects the logic of the setup rather than being an arbitrary number.
- Wait for candle confirmation before entering. Jumping in before a candle actually closes invites false signals; patience for the close often saves traders from premature entries.
- Size positions around invalidation points. Let the distance to your stop-loss determine position size, rather than trading a fixed size regardless of how far price needs to move to prove you wrong.
- Trade with the higher timeframe trend when possible. A bullish pattern in the direction of a larger uptrend tends to carry better odds than one fighting against it.
- Accept that not every pattern will work. Price action improves the odds, but no candle formation guarantees an outcome — risk control is what keeps a losing pattern from becoming a costly one.
Common Mistakes Beginners Make
Price action feels intuitive once it clicks, but a few habits trip up almost every trader in the early stages.
- Seeing patterns everywhere. Forcing a "pin bar" or "engulfing candle" label onto every messy candle, rather than waiting for genuinely clean formations.
- Ignoring the broader context. Trading a bullish pattern that appears right into strong resistance, without considering what's happening around it.
- Entering before the candle closes. Acting on a pattern that's still forming, only to watch it completely change shape by the close.
- Overcomplicating with too many patterns. Trying to memorize dozens of formations instead of mastering a handful thoroughly.
- Neglecting higher timeframes. Focusing only on a 5-minute chart while ignoring what the daily or weekly chart is showing about the bigger picture.
- Trading without a stop-loss. Assuming a "clean" pattern doesn't need protection — every setup, however textbook it looks, can still fail.
Conclusion
Price action for beginners can feel slow to learn at first, since it relies on pattern recognition built through repetition rather than a formula you can memorize overnight. But once it clicks, it offers something indicators alone rarely do — a direct, uncluttered read on what buyers and sellers are actually doing in real time. Start with a small handful of reliable patterns, always trade them in context, protect every position with a sensible stop-loss, and let screen time do the rest of the teaching.
The chart is already telling the story. Price action is simply learning to read it without the noise in between.
Frequently Asked Questions
1. Do I need any indicators at all for price action trading?
Not necessarily, though many traders still use a light touch — a moving average for trend context or volume for confirmation. The core decisions, however, come from price itself rather than the indicators.
2. Which candlestick pattern should beginners learn first?
The pin bar and the engulfing candle are usually the best starting points, since they're visually clear, appear frequently, and teach the core idea of rejection and reversal in a straightforward way.
3. Can price action be used alongside other strategies like swing trading or scalping?
Yes, and it often is. Many swing traders and scalpers use price action patterns purely for precise entry and exit timing, layered on top of their broader strategy.
4. Is price action trading harder to learn than indicator-based trading?
It can feel that way initially, since it relies more on visual judgment than fixed rules. With consistent screen time and pattern practice, though, most traders find it becomes second nature.